

Financial planning that
brings the pieces together.
HOW WE HELP
We help you make coordinated decisions about retirement income, investments, taxes, Social Security, and healthcare.

Our Services
Retirement Planning
Build a clear plan for when to retire, how much you can spend, and where your income will come from.

Investment Management
Manage your portfolio around your goals, income needs, timeline, and comfort with risk.

Tax-Aware Planning

Coordinate withdrawals, Roth conversions, capital gains, and RMD decisions.
Social Security & Medicare
Understand claiming choices, enrollment timing, IRMAA, and healthcare costs.

Insurance & Annuity Review
Review whether existing coverage and contracts still support your plan.
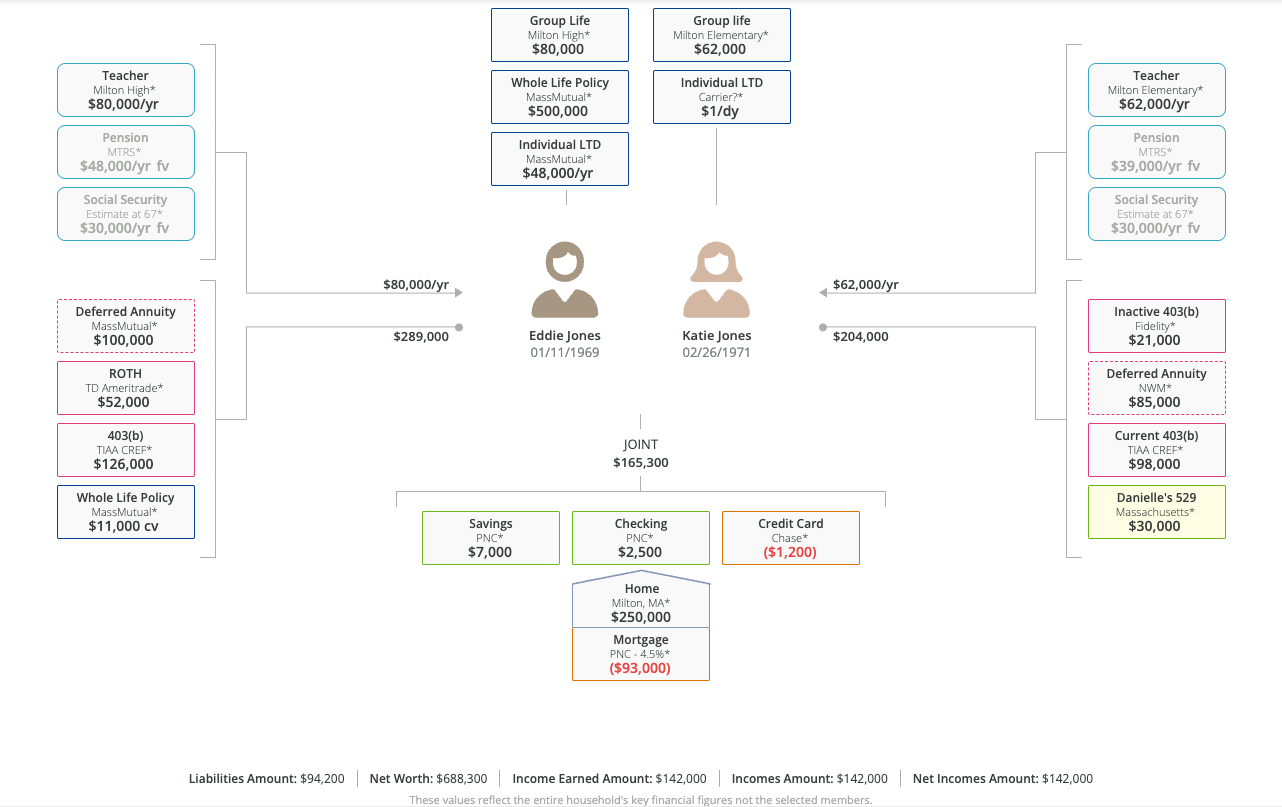
We use Asset-Map to organize your accounts, income, insurance, and financial priorities into a clear visual overview. This helps us identify gaps, coordinate decisions, and focus our conversations on what matters most to you.
See Your Financial Life in One Place
Start with a conversation.
Tell us where you are, what matters to you, and the decisions ahead